
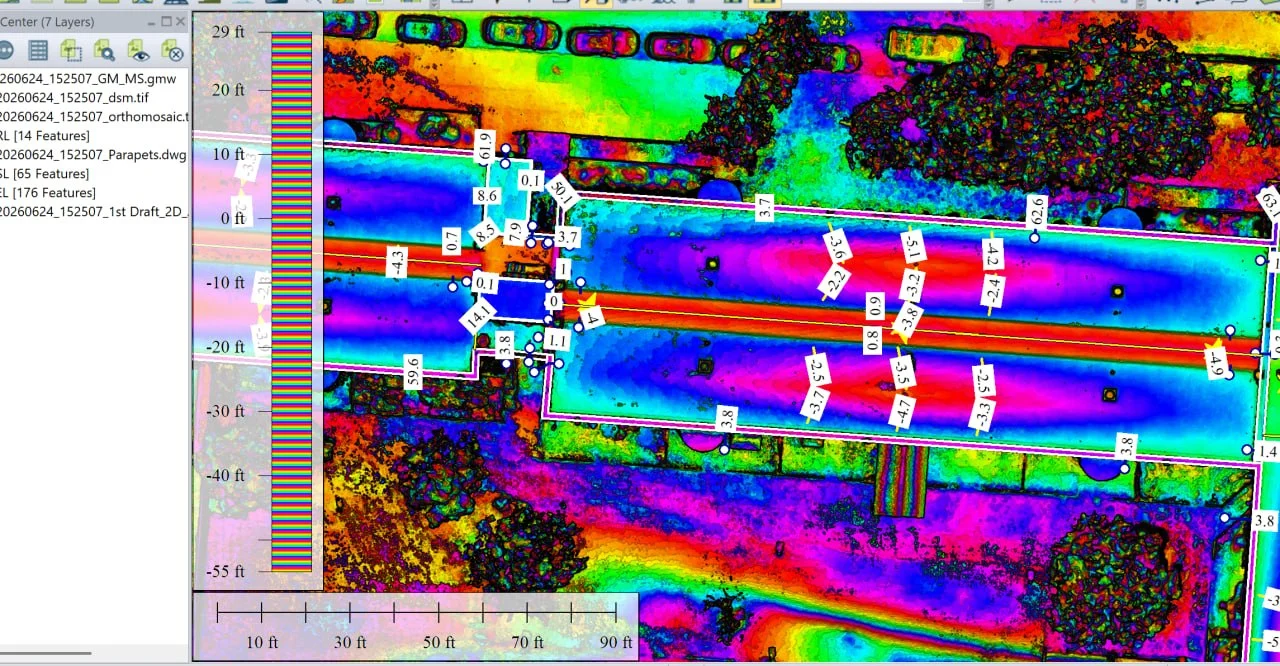
A commercial low-slope roof was surveyed using drone-captured aerial imagery and processed into a full GIS deliverable set: a digital surface model, an orthomosaic, roof edge and parapet vector lines, and a series of derived layers used to evaluate roof geometry and drainage behaviour.
The goal was a clear, visual picture of where water collects, how it should flow toward the drains, and where the roof edge and parapet lines sit geometrically — without walking the roof or reading a raw point cloud by hand.
Data capture
Imagery was captured across the entire roof area — rooftop equipment, edges, drains and parapet lines included — at a resolution sufficient for centimetre-level surface modelling.
Processing and analysis layers
A digital surface model and orthomosaic were built from the captured imagery, then used to derive the layers that make roof condition legible:
- An elevation deviation heatmap, showing high and low points relative to the drain lines
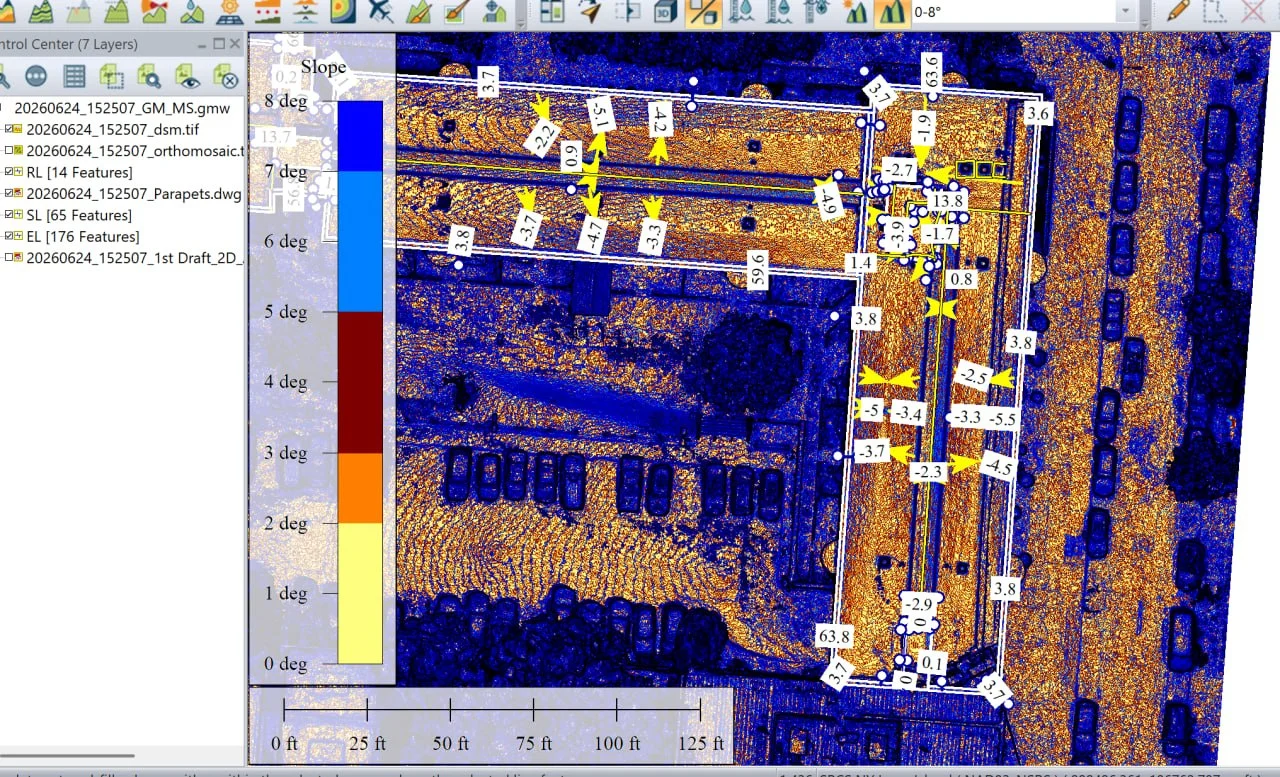
- Slope maps in degrees, isolating the flat and near-flat zones where ponding risk is highest
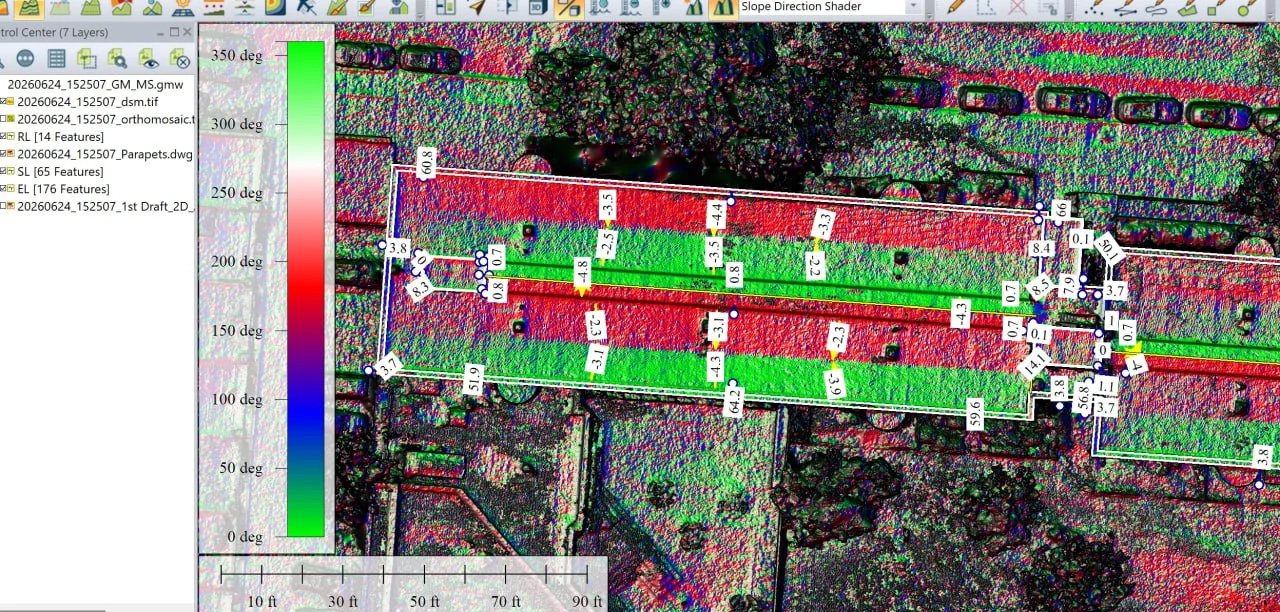
- Slope direction (aspect) maps, confirming whether water actually flows toward the intended drains
- Vectorised roof edges, parapets and drainage lines, feeding a 2D CAD draft for reporting
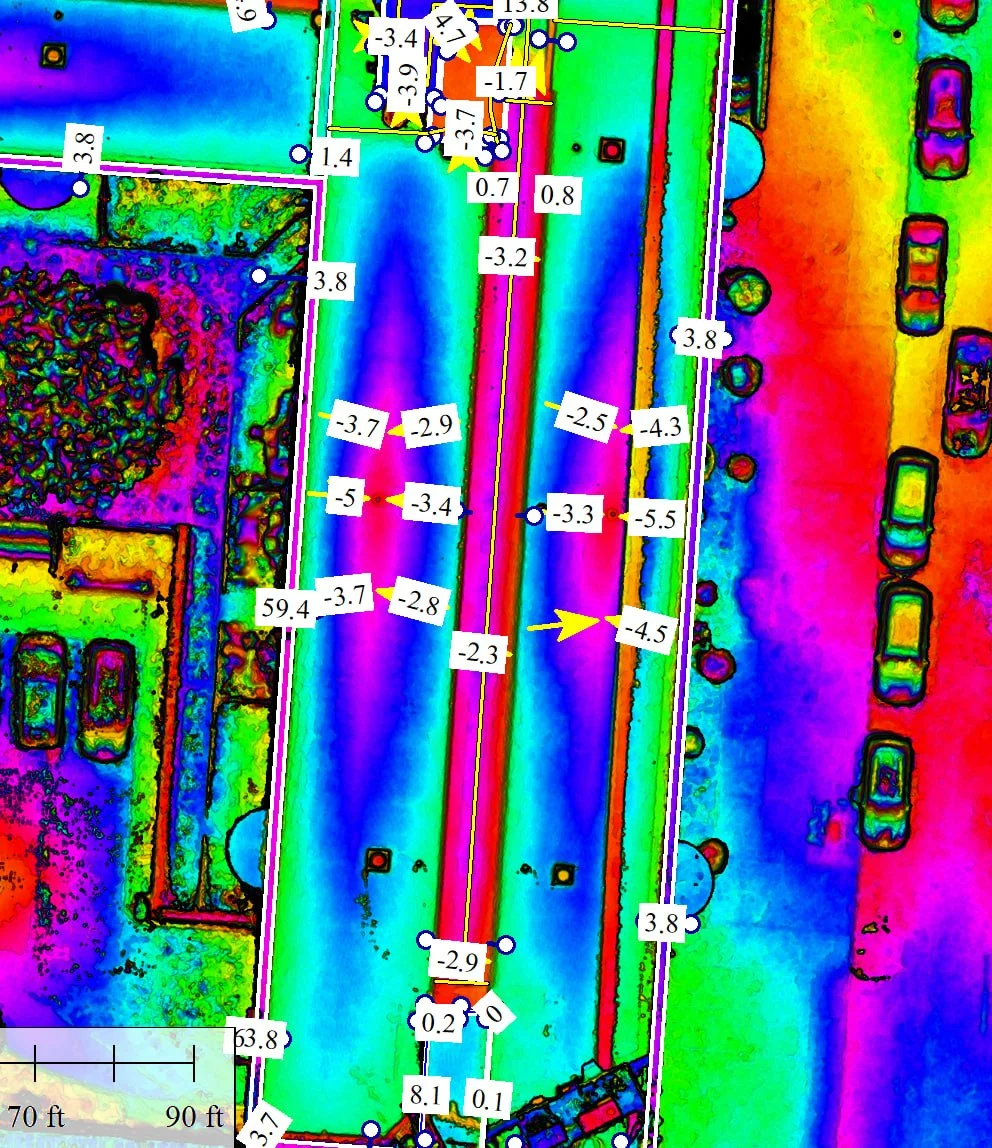
Elevation deviation and drainage lines
Elevation deviation is colour-coded relative to the drain line, with values in inches labelled at key points. The banding shows where the surface rises or dips away from the intended drainage slope.
Slope direction mapping
Aspect layers show the compass direction water will move across each part of the roof. Consistent, uniform bands confirm a clean fall toward the drains; mixed or reversed bands flag the areas that need attention.
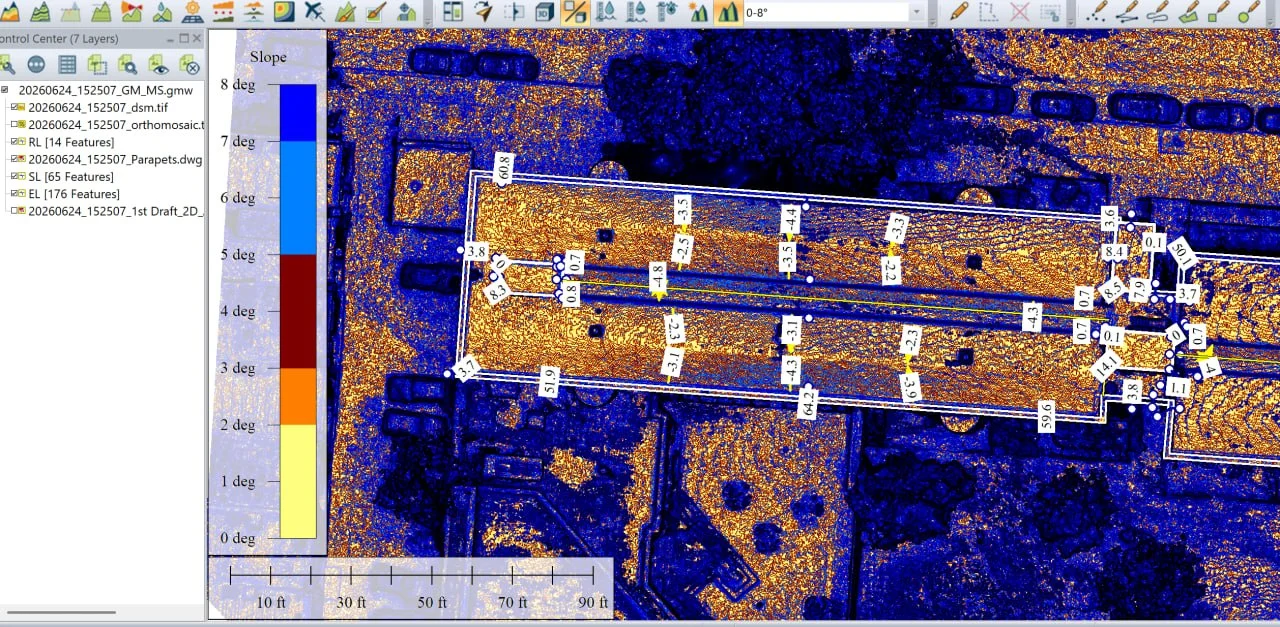
Slope degree mapping
Slope-degree layers isolate the flattest zones of the roof — the areas most likely to hold standing water after rain.
Deliverables
- Digital surface model and orthomosaic
- Roof edge, parapet, slope-line and elevation-line vector layers, with 176 elevation features mapped
- Slope, aspect and elevation-deviation raster layers
- A first-draft 2D CAD drawing summarising roof geometry and drainage condition
What it gives the client
- Ponding-risk zones identified before they become leaks or membrane damage
- Independent visual confirmation that drainage falls the way it was designed to
- A reporting-ready package that can be handed to roofing contractors or facilities teams
- All of it from a single flight, with no roof access required for the assessment itself
Image credit
Imagery and GIS processing in this case study are the work of GIS-Point, reproduced here with their permission. GIS-Point provides technical GIS teams for mapping, orthophoto, 2D/3D, thermal inspection and LiDAR data processing.
Start a conversation
Have a project in mind?
Tell us what you need to inspect, map, document or monitor.