
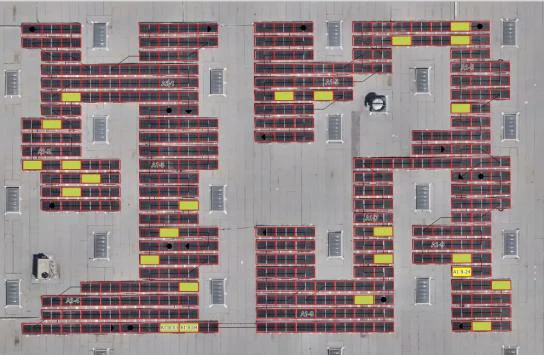
A photovoltaic installation was inspected using drone-captured thermal and orthophoto imagery, then processed into an annotated GIS layer identifying and classifying panel-level anomalies across every module and string in the array.
The goal was a structured picture of which modules are underperforming or faulty, where each anomaly sits within the array, and how the issues break down by type — without inspecting thousands of panels on site by hand.
Input data
The inspection is built on inputs that define both the site geometry and the classification standard to apply:
- A described requirement set and inspection workflow
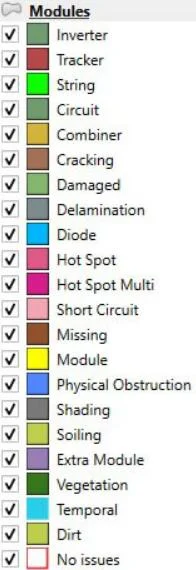
- A pre-configured QGIS project, including the anomaly classification scheme
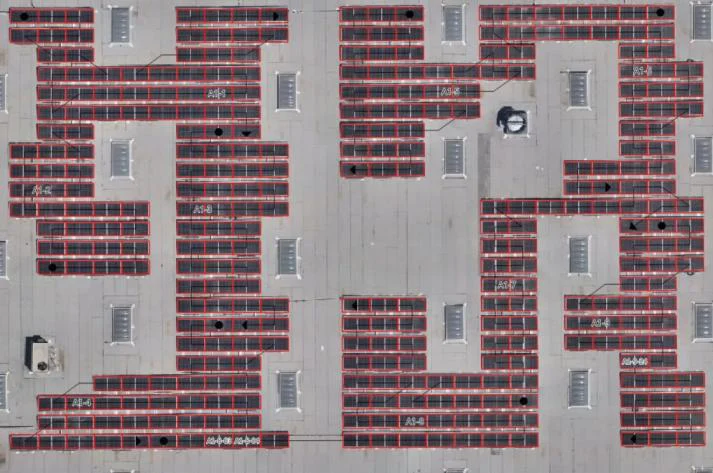
- A vector layer of empty module and string polygons matching the physical array layout
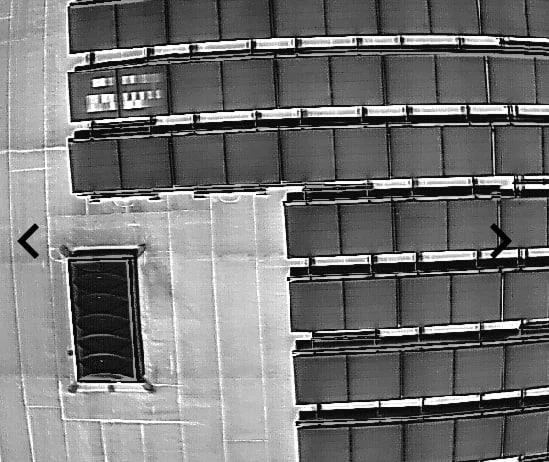
- Orthophoto and thermal imagery with visible anomalies
Processing and analysis
The anomaly review is carried out directly within the client's QGIS environment:
- Anomalies identified and classified against the supplied standard
- Each anomaly annotated in the vector layer at module and string level
- Quality control across the full dataset for consistency and accuracy
Every flagged module is tagged with its anomaly type, so the final layer can be filtered, counted and reported on by category — hot spots, cracking, delamination, soiling, shading, diodes or physical obstruction among them.
Result
The output is a single vector file with every module reviewed and every anomaly marked and classified, ready for further analysis or reporting.
Deliverables
- A fully annotated vector layer, with every module and string reviewed
- Anomalies classified by type — hot spot, cracking, delamination, soiling, shading, diode, physical obstruction and more
- A QC-checked dataset consistent with the classification standard supplied
- A reporting-ready output for O&M teams, or for warranty and performance analysis
What it gives the client
- A panel-level view of which modules are faulty and why, across the entire array
- Anomalies structured by type, so issues can be prioritised and tracked over time
- Consistent, QC-checked classification applied to every module rather than spot checks
- All of it derived from a single flight, with no manual on-site panel inspection
Image credit
Imagery and GIS processing in this case study are the work of GIS-Point, reproduced here with their permission. GIS-Point provides technical GIS teams for mapping, orthophoto, 2D/3D, thermal inspection and LiDAR data processing.
Start a conversation
Have a project in mind?
Tell us what you need to inspect, map, document or monitor.